Elastic Stack is a great big data and analytics platform that can be used for multiple purposes and its core functionality is free. We are using it internally on different projects but I want to share today how you can use it to collect and visualize some analytics from VMware.
Elastic Stack is composed of different pieces:
- ElasticSearch is a schema-less NOSQL database with powerful search capabilities and very scalable
- Logstash allows to receive data from multiple unstructured sources (syslog, snmp, files, etc) and parse and store them in ElasticSearch.
- Kibana is a web-based data visualization tool used to query ElasticSearch, run analytics, and create great dashboards from the data
There are multiple tutorials on the internet detailing Elastic Stack installation, so we will not cover it in this post.
We are also not covering Logstash, but you can use it to redirect vSphere hosts syslog output to store on Elastic Stack in order to search for patterns across all hosts logs.
In this post, I am going to explore how to use VMware PowerCLI to collect VMware metrics, store them in an ElasticSearch database which is explored using Kibana allowing you to create nice reports.
First, we have to open PowerCLI, connect to our vCenter and retrieve one VM. Virtual machines have a lot of properties but we are only going to collect five, indexing them in ELK.
PowerCLI C:\> $vm=get-vm agonzalez.ubuntu15|Select-Object -Property name,version,guestid,memorymb,numcpu,CoresPerSocket
PowerCLI C:\> $vm
Name           : agonzalez.ubuntu15
Version        : v8
GuestId        : ubuntu64Guest
MemoryMB       : 524288
NumCpu         : 1
CoresPerSocket : 1
With this command we have in $vm variable our vm with the properties in which we are interested. ElasticSearch exposes a REST API service so we are going to invoke a POST operation with our VM data. Let’s check first if we can reach ELK and if it is working:
PowerCLI C:\> Invoke-RestMethod -Method GET -Uri http://10.10.10.2:9200/
name         : elastic01
cluster_name : unitrends
tagline      : You Know, for Search
Now let’s index the VM as a document:

PowerCLI C:\> Invoke-RestMethod "http://10.10.10.2:9200/vmware/vm" -Method POST -Body (convertto-json $vm)
_index   : vmware
_type    : 1
_id      : AVpEUiC7LQmMQ8OiO47E
_version : 1
result   : created
_shards  : @{total=2; successful=1; failed=0}
created  : True
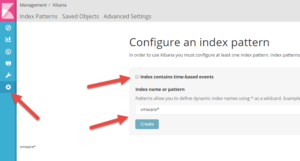
Go to Kibana http://10.10.10.2:5601
Create Index Pattern, Settings->Index Patterns->Add New. Uncheck “Index contains time-based events” and enter index name “vmware*” and Click Create.
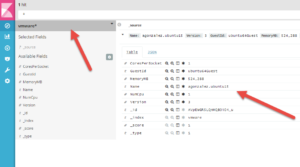
Go to Discover and select vmware* index, you will see one document with the properties you indexed.
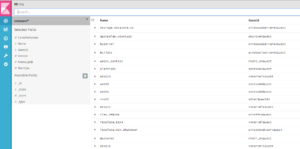
Let’s now index all VMs instead of just one:
PowerCLI C:\> $vms=get-vm |Select-Object -Property name,version,guestid,memorymb,numcpu,CoresPerSocket
PowerCLI C:\> $vms|%{Invoke-RestMethod "http://10.10.10.2:9200/vmware/vm/" -Method POST -Body (convertto-json $_)}
If we go to Kibana we will see all VMs, each indexed as a new document:
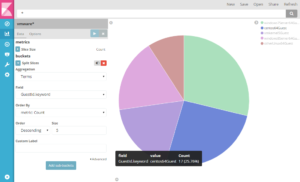
Once we have the data we can start using some of the visualization charts included.
Go to Visualize->Pie Chart->Select Index “vmware*”->Split Slices Aggregation Terms, Field: GuestId.Keywork. You will see a pie chart with each of the guest OS types we have. If you move your mouse over it, you can see there are 17 Centos6 guests.
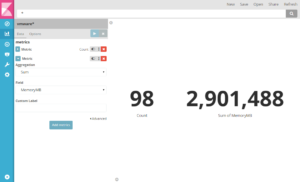
Do you want to calculate how much memory have been assigned to all VMs? You can use Visualize->Metric->Select Index “vmware*”->Aggregation=Sum Field=MemoryMB.
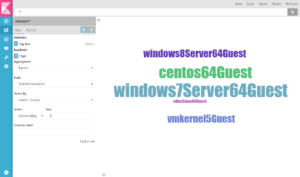
Go to Visualize->Tag Cloud and do the same to see most commonly used OS’s in a different way:
You can see how powerful this is. PowerCLI allows you collect thousands of metrics and properties that can be indexed, allowing for the creation of powerful visualizations.

In the same way as explained here you can use Unitrends PowerShell Toolkit to collect data from our appliances for indexing and visualization in Kibana and for creating great reports.
Follow us on LinkedIn and Twitter so you do not miss future PowerShell posts!